In this post let’s see how we can create Pie Charts in Xamarin forms using Oxyplot. Oxyplot is a .net library licensed under MIT so it is free for commercial application too. So let’s create a Xamarin form and implement Oxyplot library to create Pie Charts. We will create for both Xamarin iOS and Xamarin Android applications. This Xamarin Pie Charts can be useful for representing a Graphical UI for your data to the clients or users and applications with Charts generally look more interesting.
I’m using MVVM architecture to develop this Xamarin Charts application.
Xamarin Forms Create Pie Charts with Oxyplot:
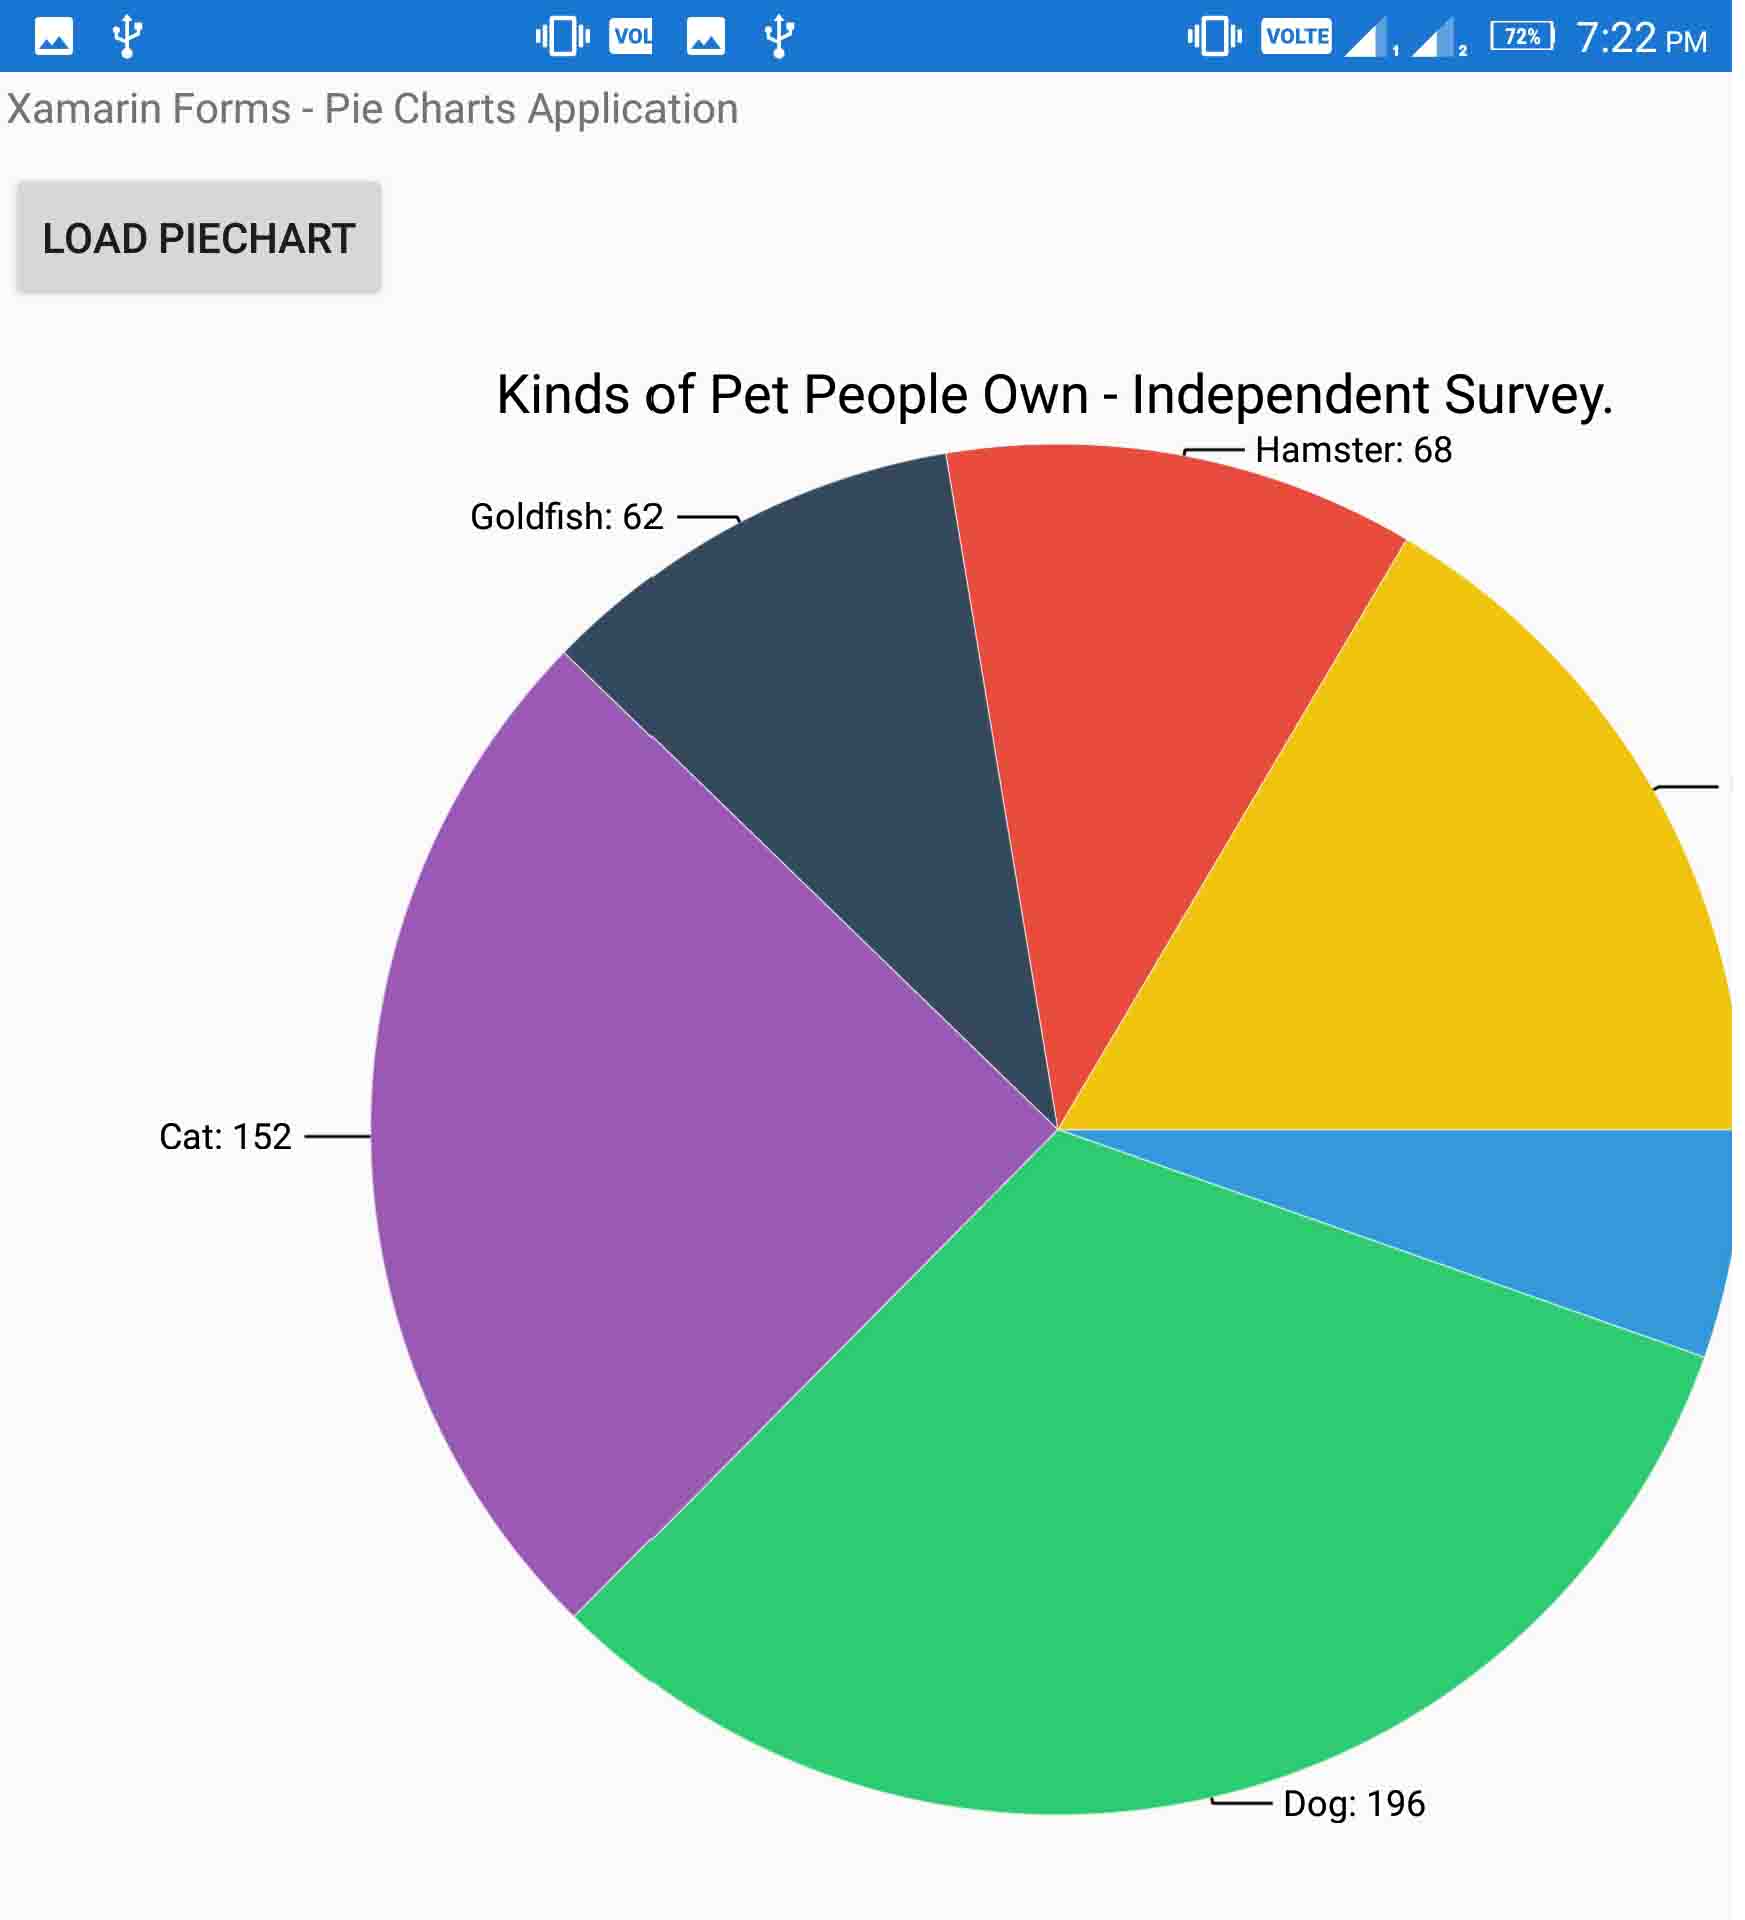
Xamarin Forms Creating Pie Charts with Oxyplot – Final Screen
OxyPlot libraries for Xamarin forms are available as nuget packages, so you can directly install them within Visual studio.
In your Xamarin Project install the following Nuget Packages :
2. OxyPlot.Xamarin.Android.1.0.0
3. OxyPlot.Xamarin.Forms.1.0.0
Create a Content Page with name PieChart.xaml in your Project and edit it as below :
PieChart.xaml:
<?xml version="1.0" encoding="utf-8" ?>
<ContentPage xmlns="http://xamarin.com/schemas/2014/forms"
xmlns:x="http://schemas.microsoft.com/winfx/2009/xaml"
xmlns:oxy="clr-namespace:OxyPlot.Xamarin.Forms;assembly=OxyPlot.Xamarin.Forms"
x:Class="XamarinGraphsEx.PieChart">

<StackLayout Orientation="Vertical">
<ScrollView Orientation="Both">
<StackLayout Orientation="Vertical" WidthRequest="1000" >
<Label Text="Xamarin Forms - Pie Charts Application" Margin="2" />
<Button Command="{Binding btnPieGraph}" x:Name="btnLoadGraph" Text="Load Piechart" Margin="2"
HorizontalOptions="Start" VerticalOptions="Start"/>
<oxy:PlotView Model="{Binding PieModel}" HorizontalOptions="Start"
VerticalOptions="StartAndExpand" Margin="2"
HeightRequest="500" WidthRequest="700"/>

</StackLayout>
</ScrollView>
</StackLayout>

</ContentPage>
And edit its .cs page as below :
PieChart.xaml.cs:
using System;
using System.Collections.Generic;
using System.Linq;
using System.Text;
using System.Threading.Tasks;

using Xamarin.Forms;
using Xamarin.Forms.Xaml;
using XamarinGraphsEx.ViewModels;

namespace XamarinGraphsEx
{
[XamlCompilation(XamlCompilationOptions.Compile)]
public partial class PieChart : ContentPage
{
PieChartViewModel vm;
public PieChart()
{
vm = new PieChartViewModel();
InitializeComponent();
this.BindingContext = vm;
}
}
}
Create a Folder named ViewModels in your project. We will create ViewModel classes inside this folder.
Add a class with name PieChartViewModel.cs inside ViewModels folder.
PieChartViewModel.cs:
using OxyPlot;
using OxyPlot.Series;
using System;
using System.Collections.Generic;
using System.ComponentModel;
using System.Text;
using System.Windows.Input;
using Xamarin.Forms;
namespace XamarinGraphsEx.ViewModels
{
public class PieChartViewModel : INotifyPropertyChanged
{

private PlotModel pieModel { get; set; }

public PlotModel PieModel
{
get
{
return pieModel;
}
set
{
pieModel = value;
}
}
public ICommand btnPieGraph { get; set; }

public PieChartViewModel()
{
btnPieGraph = new Command(LoadPieChart);
}

public void LoadPieChart()
{
PieModel = null;
OnPropertyChanged("PieModel");
var piemodel = new PlotModel { Title = "Kinds of Pet People Own - Independent Survey." };
var ps = new PieSeries
{
StrokeThickness = 0.25,
AngleSpan = 360,
StartAngle = 0,
InsideLabelFormat = "",
OutsideLabelFormat = "{1}: {0}",
TickHorizontalLength = 20,
TickRadialLength = 2
};

ps.Slices.Add(new PieSlice("Rabbit", 33) { IsExploded = false, Fill = OxyColor.Parse("#3498db") });

ps.Slices.Add(new PieSlice("Dog", 196) { IsExploded = false, Fill = OxyColor.Parse("#2ecc71") });

ps.Slices.Add(new PieSlice("Cat", 152) { IsExploded = false, Fill = OxyColor.Parse("#9b59b6") });

ps.Slices.Add(new PieSlice("Goldfish", 62) { IsExploded = false, Fill = OxyColor.Parse("#34495e") });

ps.Slices.Add(new PieSlice("Hamster", 68) { IsExploded = false, Fill = OxyColor.Parse("#e74c3c") });

ps.Slices.Add(new PieSlice("Birds", 101) { IsExploded = false, Fill = OxyColor.Parse("#f1c40f") });
piemodel.Series.Add(ps);
PieModel = piemodel;

OnPropertyChanged("PieModel");
}

#region INotifyChangedProperties
public event PropertyChangedEventHandler PropertyChanged;

private void OnPropertyChanged(string propertyName)
{
if (PropertyChanged != null)
{
PropertyChanged(this, new PropertyChangedEventArgs(propertyName));
}
}
#endregion INotifyChangedProperties
}
}
Now run your application :
Download Xamarin Forms Charts/Bar Graphs/Pie Chart application source code :
Xamarin Forms Charts/Bar Graphs/Pie Chart application source code
Password : parallelcodes
Also see : Xamarin Forms Creating Bar Graph Charts with Oxyplot