In this post let’s see how we can create Graph Charts in Xamarin forms using Oxyplot. Oxyplot is a .net library licensed under MIT so it is free for commercial application too. So let’s create a Xamarin form and implement Oxyplot library to create bar graphs. We will create for both Xamarin iOS and Xamarin Android applications. This Xamarin Bar Graphs can be useful for representing a Graphical UI for your data to the clients or users and applications with Charts generally look more interesting.
I’m using MVVM architecture to develop this Xamarin Charts application.
Xamarin Forms Creating Bar Graph Charts with Oxyplot:
OxyPlot libraries for Xamarin forms are available as nuget packages, so you can directly install them within Visual studio.
In your Xamarin Project install the following Nuget Packages :
2. OxyPlot.Xamarin.Android.1.0.0
3. OxyPlot.Xamarin.Forms.1.0.0
Create a new XAML Page in your Xamarin Project with name MainPage.xaml and edit it as below :
MainPage.xaml :
<?xml version="1.0" encoding="utf-8" ?>
<ContentPage xmlns="http://xamarin.com/schemas/2014/forms"
xmlns:x="http://schemas.microsoft.com/winfx/2009/xaml"
xmlns:local="clr-namespace:XamarinGraphsEx"
xmlns:oxy="clr-namespace:OxyPlot.Xamarin.Forms;assembly=OxyPlot.Xamarin.Forms"
x:Class="XamarinGraphsEx.MainPage">

<StackLayout Orientation="Vertical">
<ScrollView Orientation="Both">
<StackLayout Orientation="Vertical">
<Label Text="Xamarin Forms - OxyPlot Bar Graphs Application" Margin="2" />
<StackLayout Orientation="Horizontal">
<Button Command="{Binding btnLoadGraph}" x:Name="btnLoadGraph" Text="Load Graph" Margin="2"
HorizontalOptions="Start" VerticalOptions="Start"/>
</StackLayout>
<oxy:PlotView Model="{Binding GraphModel}" HorizontalOptions="CenterAndExpand"
VerticalOptions="StartAndExpand" Margin="2"
HeightRequest="500" WidthRequest="500"/>

</StackLayout>
</ScrollView>
</StackLayout>

</ContentPage>
Edit the code file as below :
MainPage.xaml.cs:
using System;
using System.Collections.Generic;
using System.Linq;
using System.Text;
using System.Threading.Tasks;
using Xamarin.Forms;
using XamarinGraphsEx.ViewModels;

namespace XamarinGraphsEx
{
public partial class MainPage : ContentPage
{
MainPageViewModel vm;
public MainPage()
{
vm = new MainPageViewModel();
InitializeComponent();
this.BindingContext = vm;
}

}
}
This form will have Binding Context set to Xamarin View Model named “MainPageViewModel.cs”. The <oxy:PlotView/> tag in the design code will help us to create Xamarin Bar Graphs and other Xamarin charts.
Create a Folder named ViewModels in your project and create a new class with name MainPageViewModel.cs in it.
MainPageViewModel.cs:
using OxyPlot;
using OxyPlot.Axes;
using OxyPlot.Series;
using System;
using System.Collections.Generic;
using System.ComponentModel;
using System.Text;
using System.Windows.Input;
using Xamarin.Forms;
namespace XamarinGraphsEx.ViewModels
{
public class MainPageViewModel : INotifyPropertyChanged
{
private PlotModel graphModel { get; set; }
public PlotModel GraphModel
{
get
{
return graphModel;
}
set
{
graphModel = value;
}
}
public ICommand btnLoadGraph { get; set; }
public MainPageViewModel()
{
GraphModel = new PlotModel();
btnLoadGraph = new Command(LoadBarChart);
}
public void LoadBarChart()
{
GraphModel = null;
OnPropertyChanged("GraphModel");
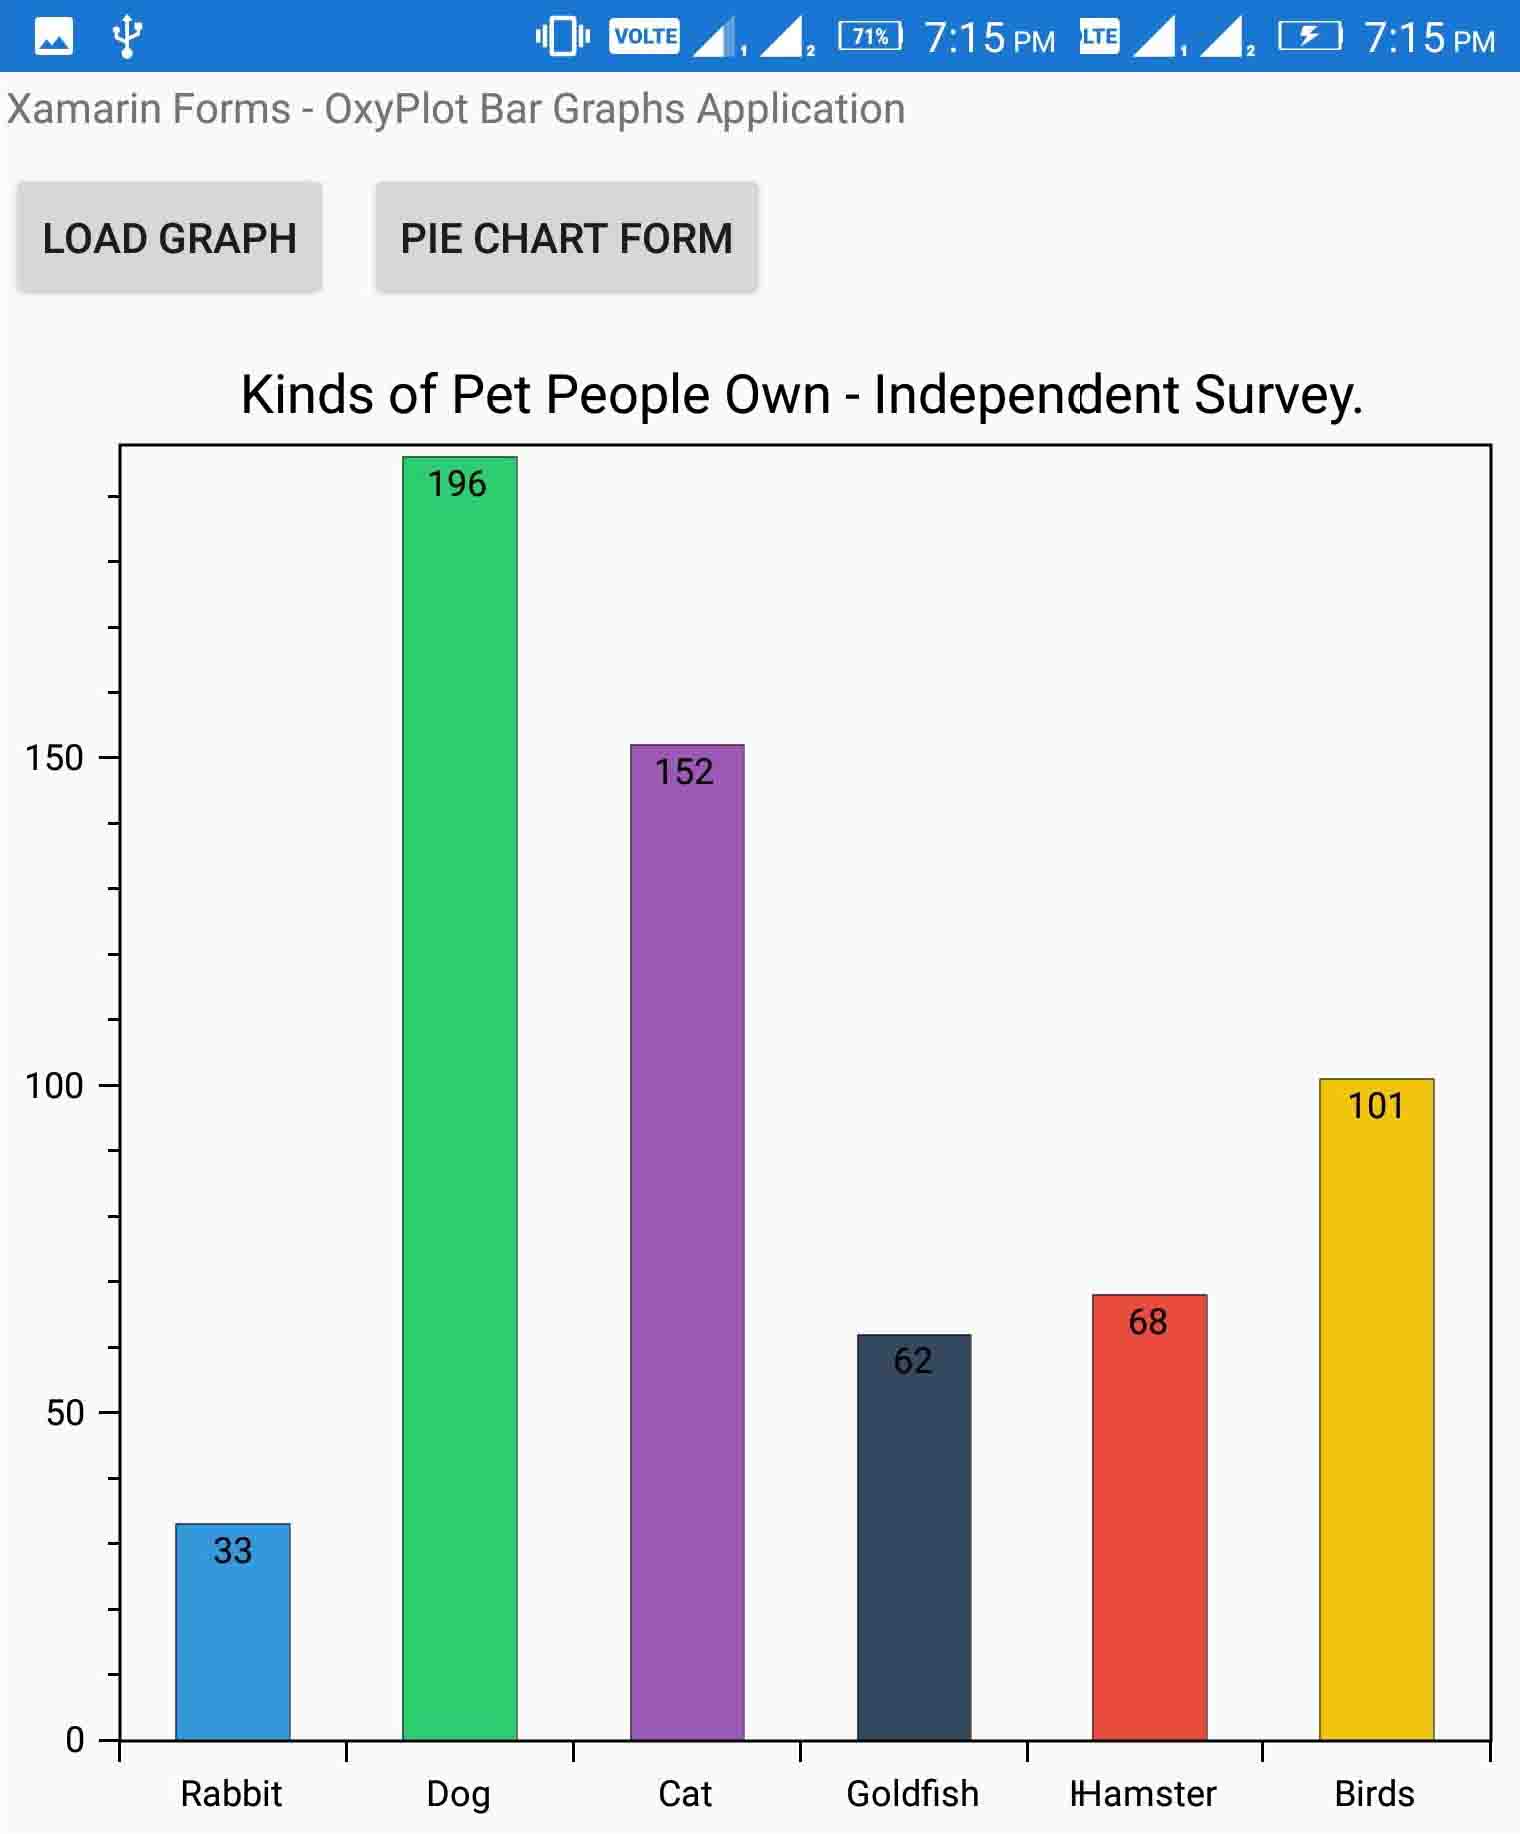
var model = new PlotModel { Title = "Kinds of Pet People Own - Independent Survey." };
var barSeries = new ColumnSeries
{
LabelPlacement = LabelPlacement.Inside,
LabelFormatString = "{0}"
};
barSeries.Items.Add(new ColumnItem
{
Value = Convert.ToDouble(33),
Color = OxyColor.Parse("#3498db")
});
barSeries.Items.Add(new ColumnItem
{
Value = Convert.ToDouble(196),
Color = OxyColor.Parse("#2ecc71")
});
barSeries.Items.Add(new ColumnItem
{
Value = Convert.ToDouble(152),
Color = OxyColor.Parse("#9b59b6")
});
barSeries.Items.Add(new ColumnItem
{
Value = Convert.ToDouble(62),
Color = OxyColor.Parse("#34495e")
});
barSeries.Items.Add(new ColumnItem
{
Value = Convert.ToDouble(68),
Color = OxyColor.Parse("#e74c3c")
});
barSeries.Items.Add(new ColumnItem
{
Value = Convert.ToDouble(101),
Color = OxyColor.Parse("#f1c40f")
});
model.Series.Add(barSeries);
String[] strNames = new String[] { "Rabbit", "Dog", "Cat", "Goldfish", "Hamster", "Birds" };
model.Axes.Add(new CategoryAxis
{
Position = AxisPosition.Bottom,
Key = "Sample Data",
ItemsSource = strNames,
IsPanEnabled = false,
IsZoomEnabled = false,
Selectable = false,
});
GraphModel = model;
OnPropertyChanged("GraphModel");
}
#region INotifyChangedProperties
public event PropertyChangedEventHandler PropertyChanged;
private void OnPropertyChanged(string propertyName)
{
if (PropertyChanged != null)
{
PropertyChanged(this, new PropertyChangedEventArgs(propertyName));
}
}
#endregion INotifyChangedProperties
}
}
In your Android Project, open MainActivity.cs file and Initialize Oxyplot as below :
MainActivity.cs:
using System;

using Android.App;
using Android.Content.PM;
using Android.Runtime;
using Android.Views;
using Android.Widget;
using Android.OS;

namespace XamarinGraphsEx.Droid
{
[Activity(Label = "XamarinGraphsEx", Icon = "@drawable/icon", Theme = "@style/MainTheme", MainLauncher = true, ConfigurationChanges = ConfigChanges.ScreenSize | ConfigChanges.Orientation)]
public class MainActivity : global::Xamarin.Forms.Platform.Android.FormsAppCompatActivity
{
protected override void OnCreate(Bundle bundle)
{
TabLayoutResource = Resource.Layout.Tabbar;
ToolbarResource = Resource.Layout.Toolbar;

base.OnCreate(bundle);

global::Xamarin.Forms.Forms.Init(this, bundle);

OxyPlot.Xamarin.Forms.Platform.Android.PlotViewRenderer.Init();
LoadApplication(new App());
}
}
}
Now open your Xamarin iOS Project and edit the AppDelegate.cs file as below to initialize Oxyplot:
AppDelegate.cs:
using System;
using System.Collections.Generic;
using System.Linq;

using Foundation;
using UIKit;

namespace XamarinGraphsEx.iOS
{
// The UIApplicationDelegate for the application. This class is responsible for launching the
// User Interface of the application, as well as listening (and optionally responding) to
// application events from iOS.
[Register("AppDelegate")]
public partial class AppDelegate : global::Xamarin.Forms.Platform.iOS.FormsApplicationDelegate
{
//
// This method is invoked when the application has loaded and is ready to run. In this
// method you should instantiate the window, load the UI into it and then make the window
// visible.
//
// You have 17 seconds to return from this method, or iOS will terminate your application.
//
public override bool FinishedLaunching(UIApplication app, NSDictionary options)
{
global::Xamarin.Forms.Forms.Init();
OxyPlot.Xamarin.Forms.Platform.iOS.PlotViewRenderer.Init();
LoadApplication(new App());

return base.FinishedLaunching(app, options);
}
}
}
Xamarin Forms Creating Bar Graph Charts with Oxyplot : Application –
Download Xamarin Forms Charts/Bar Graphs/Pie Chart application source code :
Xamarin Forms Charts/Bar Graphs/Pie Chart application source code
Password : parallelcodes
Also see : Xamarin Forms Creating Pie Charts with Oxyplot