Chart.js is an open source Javascript library using which we can create different kinds of graph. Creating different kinds of graph is well documented on its official documentation. In the previous post we saw how to create bar graph chart using Chart.js. In this post we will explore how to create a dynamic chart using a web API response.
I have created a local API response using json-server, if you want to learn about json-server more please visit this post. I’m running my local API on port 8000. It is a simple GET request which returns top 10 countries with GDP value in a descending order.
API URL: http://localhost:3000/gdp/
I will be using jQuery to call API.
Calling the API:
var gdpValues = [];
var countryNames = [];

$.ajax({
type: 'GET',
url: 'http://localhost:3000/gdp/',
headers: {
'Content-Type': 'application/json'
},
success: function (data, status, xhr) {

var gdpData = data;

gdpData.forEach(element => {
gdpValues.push(element.value);
countryNames.push(element.name);
});

createBarGraph(gdpValues, countryNames);

}
});
Here I’m calling the API at http://localhost:3000/gdp/ with a GET request. There are 2 objects to hold the GDP information: country-name and gdp-value.
Creating Bar Graph:
function createBarGraph(val, name) {
let barChart = new Chart("myChart", {
type: "bar",
data: {
labels: name,
datasets: [{
data: val,
label: 'GDP Value (in Trillions)',
backgroundColor: ["#b71540", "#eb2f06", "#f6b93b", "#0c2461", "#1e3799",
"#0a3d62", "#60a3bc", "#079992", "#78e08f", "#6a89cc"]
}]
},
options:{

}
});
}
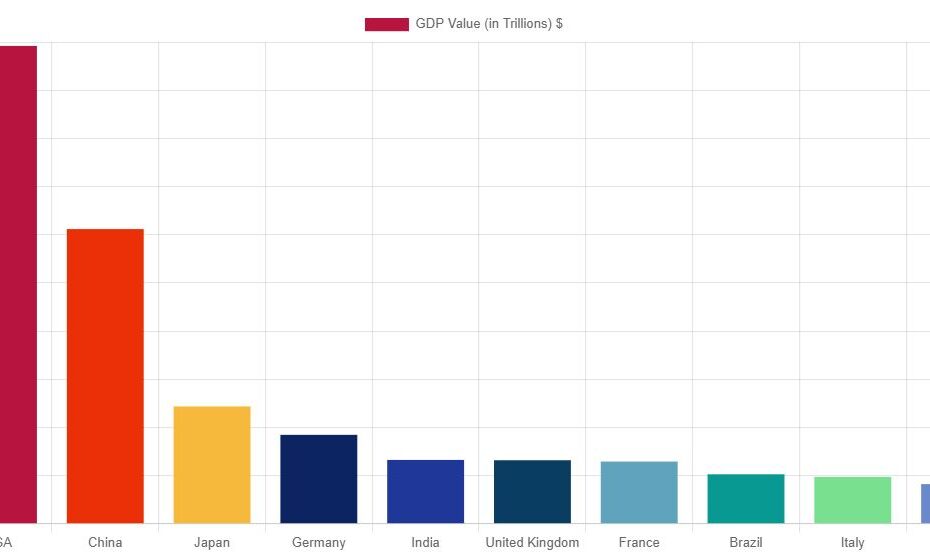
This function will create the bar graph with Chart.js library. The HTML element name on my page for the Chart is myChart and the type is bar
Output:
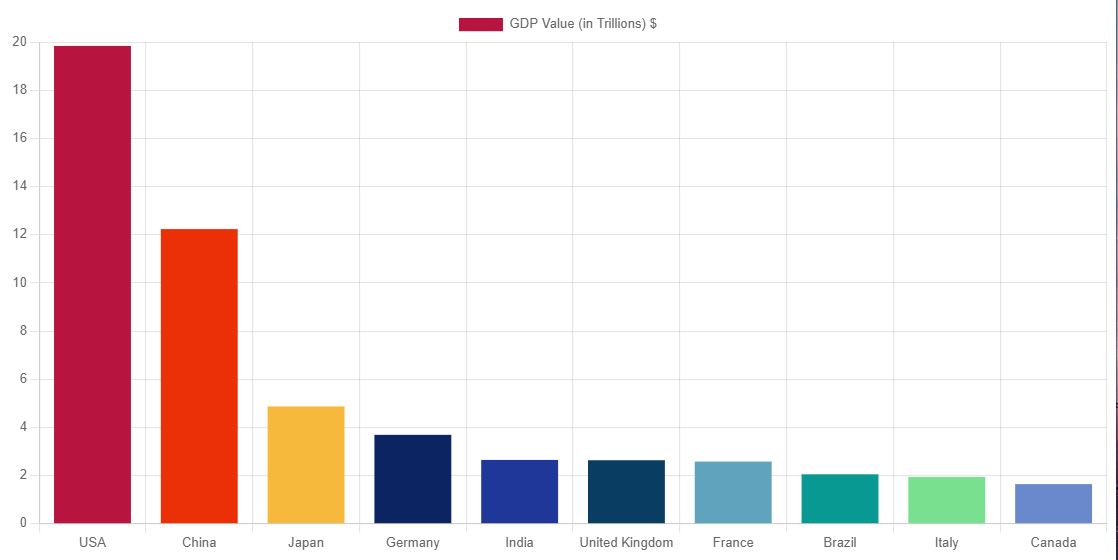
how-to-create-chart-js-bar-graph-dynamically-with-web-api-using-jquery
Complete code:
<html>
<head>
<title>Chart.js example</title>
</head>

<body>
<div>
<canvas id="myChart"></canvas>
</div>

<script src="https://code.jquery.com/jquery-3.6.0.min.js"
integrity="sha256-/xUj+3OJU5yExlq6GSYGSHk7tPXikynS7ogEvDej/m4=" crossorigin="anonymous"></script>

<script src="https://cdn.jsdelivr.net/npm/chart.js"></script>
<script>

var gdpValues = [];
var countryNames = [];

$.ajax({
type: 'GET',
url: 'http://localhost:3000/gdp/',
headers: {
'Content-Type': 'application/json'
},
success: function (data, status, xhr) {

var gdpData = data;

gdpData.forEach(element => {
gdpValues.push(element.value);
countryNames.push(element.name);
});

createBarGraph(gdpValues, countryNames);

}
});

function createBarGraph(val, name) {
let barChart = new Chart("myChart", {
type: "bar",
data: {
labels: name,
datasets: [{
data: val,
label: 'GDP Value (in Trillions)',
backgroundColor: ["#b71540", "#eb2f06", "#f6b93b", "#0c2461", "#1e3799",
"#0a3d62", "#60a3bc", "#079992", "#78e08f", "#6a89cc"]
}]
},
options:{

}
});
}
</script>

</body>

</html>
You can call the WebAPI with different libraries. Here I am using jQuery Ajax which I have imported using the script before the body along with Chart.js library.
The Chart will be plotted on the canvas element:
<canvas id="myChart"></canvas>
In the upcoming post I will explore more chart with this library. Below is a snapshot of the API and complete API response is mentioned after that using which I have create this dynamic bar graph chart.
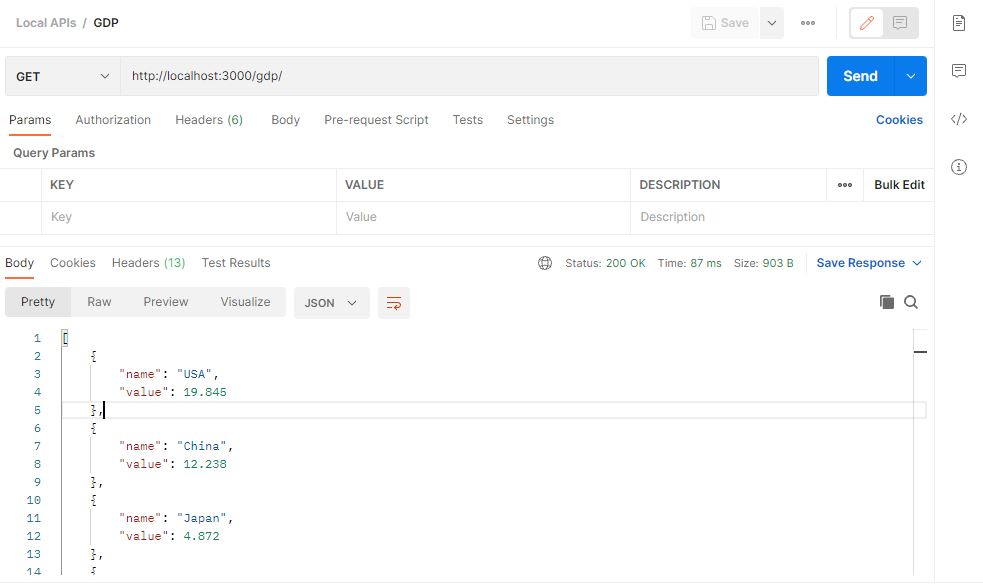
json-server-api-response-get-request
Complete API response:
[
{
"name": "USA",
"value": 19.845
},
{
"name": "China",
"value": 12.238
},
{
"name": "Japan",
"value": 4.872
},
{
"name": "Germany",
"value": 3.693
},
{
"name": "India",
"value": 2.651
},
{
"name": "United Kingdom",
"value": 2.638
},
{
"name": "France",
"value": 2.583
},
{
"name": "Brazil",
"value": 2.054
},
{
"name": "Italy",
"value": 1.944
},
{
"name": "Canada",
"value": 1.647
}
]