Chart.js is an open source Javascript library using which we can create different charts. In this post we will learn how to create Bar Chart using Chart.js. You can check out the latest documentation on the official website.
How to create Bar Chart with Chart.js:
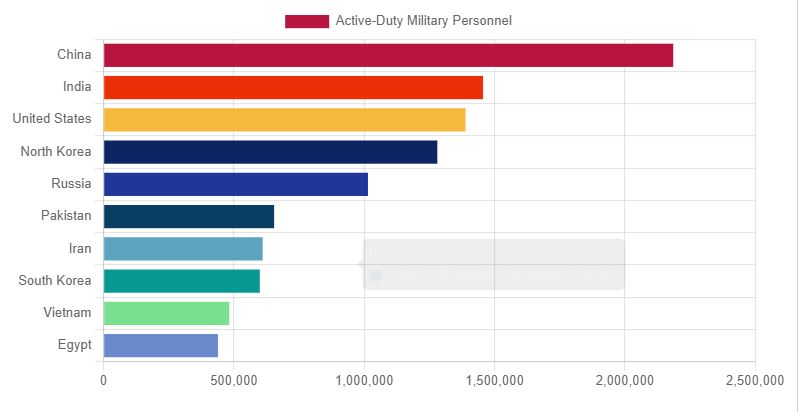
We will display the number of active military personnel available in each country in a descending order.
First include the script file for Chart.js in your page:
<script src="https://cdn.jsdelivr.net/npm/chart.js"></script>
Now add a canvas on the page:
<div>
<canvas id="myChart"></canvas>
</div>
Now add the script on the page which will contain the chart data:
<script>
const data = {
labels: ['China','India','United States','North Korea','Russia','Pakistan','Iran','South Korea','Vietnam','Egypt'],
datasets: [{
text:'Top 10 Countries with the Highest Number of Active-Duty Military Personnel',
label: 'Active-Duty Militaty Personnel',
data: [2185000,1455550,1388100,1280000,1014000,654000,610000,599000,482000,438500],
backgroundColor: ["#b71540", "#eb2f06","#f6b93b","#0c2461","#1e3799", "#0a3d62","#60a3bc","#079992","#78e08f", "#6a89cc","#f8c291","#e58e26","#b8e994"],
}],

};

const config = {
type: 'bar',
data: data
};
</script>
Now we can render our chart using the configuration:
const myChart = new Chart(
document.getElementById('myChart'),
config
);
Output:
Complete code:
<html>
<head>
<title>Chart.js example</title>
</head>
<body>
<div>
<canvas id="myChart"></canvas>
</div>

<script src="https://cdn.jsdelivr.net/npm/chart.js"></script>
<script>
const data = {
labels: ['China','India','United States','North Korea','Russia','Pakistan','Iran','South Korea','Vietnam','Egypt'],
datasets: [{
text:'Top 10 Countries with the Highest Number of Active-Duty Military Personnel',
label: 'Active-Duty Militaty Personnel',
data: [2185000,1455550,1388100,1280000,1014000,654000,610000,599000,482000,438500],
backgroundColor: ["#b71540", "#eb2f06","#f6b93b","#0c2461","#1e3799", "#0a3d62","#60a3bc","#079992","#78e08f", "#6a89cc","#f8c291","#e58e26","#b8e994"],
}],

};

const config = {
type: 'bar',
data: data
};
</script>

<script>
const myChart = new Chart(
document.getElementById('myChart'),
config
);
</script>
</body>
</html>
This is an example of a vertical bar graph. Let’s now make a Horizontal Bar graph.
For creating a Horizontal Bar Graph we need to define index axis as “y” in the configuration:
const config = {
type: 'bar',
data: data,
options:{
indexAxis: 'y',
legend:{display:false},
title:{
display: true,
text:'Top 10 Countries',
}
}
};
That’s it.
Output:
Complete code:
<html>
<head>
<title>Chart.js example</title>
</head>
<body>
<div>
<canvas id="myChart"></canvas>
</div>

<script src="https://cdn.jsdelivr.net/npm/chart.js"></script>
<script>
const data = {
labels: ['China','India','United States','North Korea','Russia','Pakistan','Iran','South Korea','Vietnam','Egypt'],
datasets: [{
text:'Top 10 Countries with the Highest Number of Active-Duty Military Personnel',
label: 'Active-Duty Military Personnel',
data: [2185000,1455550,1388100,1280000,1014000,
654000,610000,599000,482000,438500],
backgroundColor: ["#b71540", "#eb2f06","#f6b93b","#0c2461","#1e3799",
"#0a3d62","#60a3bc","#079992","#78e08f", "#6a89cc"],
}],

};

const config = {
type: 'bar',
data: data,
options:{
indexAxis: 'y',
legend:{display:false},
title:{
display: true,
text:'Top 10 Countries',
}
}
};
</script>

<script>
const myChart = new Chart(
document.getElementById('myChart'),
config
);
</script>
</body>
</html>
We will explore more types of charts available in Chart.js in the upcoming post. In the next post we will explore how to create dynamic charts using Chart.js along with Web API.
